The last couple of months, I have been looking into the newest extension of the popular PointNet and PointNet++ architectures called PointNeXt - a deep learning architecture for solving 3D point clouds tasks e.g. classification and semantic segmentation.
PointNeXt got released back in the beginning of June this year (2022) and the PointNeXt paper very recently got accepted for NeurIPS 2022. PointNeXt currently achieves state-of-the-art (SOTA) performance on the S3DIS dataset - one of the most popular 3D point cloud benchmark datasets.
In this post, we will be looking into three methods PointNeXt uses to achieve SOTA performance on S3DIS:
- Voxel downsampling
- Neighborhood Sampling
- Data augmentation
1. Voxel downsampling
One common challenge when working with 3D point clouds is the fact that point clouds are often very large. A point cloud can obviously be any size, but it is not uncommon to have point cloud dataset with millions of points per point cloud. Depending on what hardware one has available, it can be hard if not impossible to process an entire point cloud at the same time.
One way of overcoming this issue is by downsampling the point clouds using a voxel grid approach also known as voxel downsampling. Voxel downsampling reduces the number of points in the point cloud and creates a point cloud where points are uniformly spread. This is done through the following two steps:
- Points are bucketed into voxel grids - The greater the voxel size is the more points are bucketed into the same voxel grid.
- Each occupied voxel grid generates exact one point by averaging all points inside.
The approach is illustrated in the figure 1.
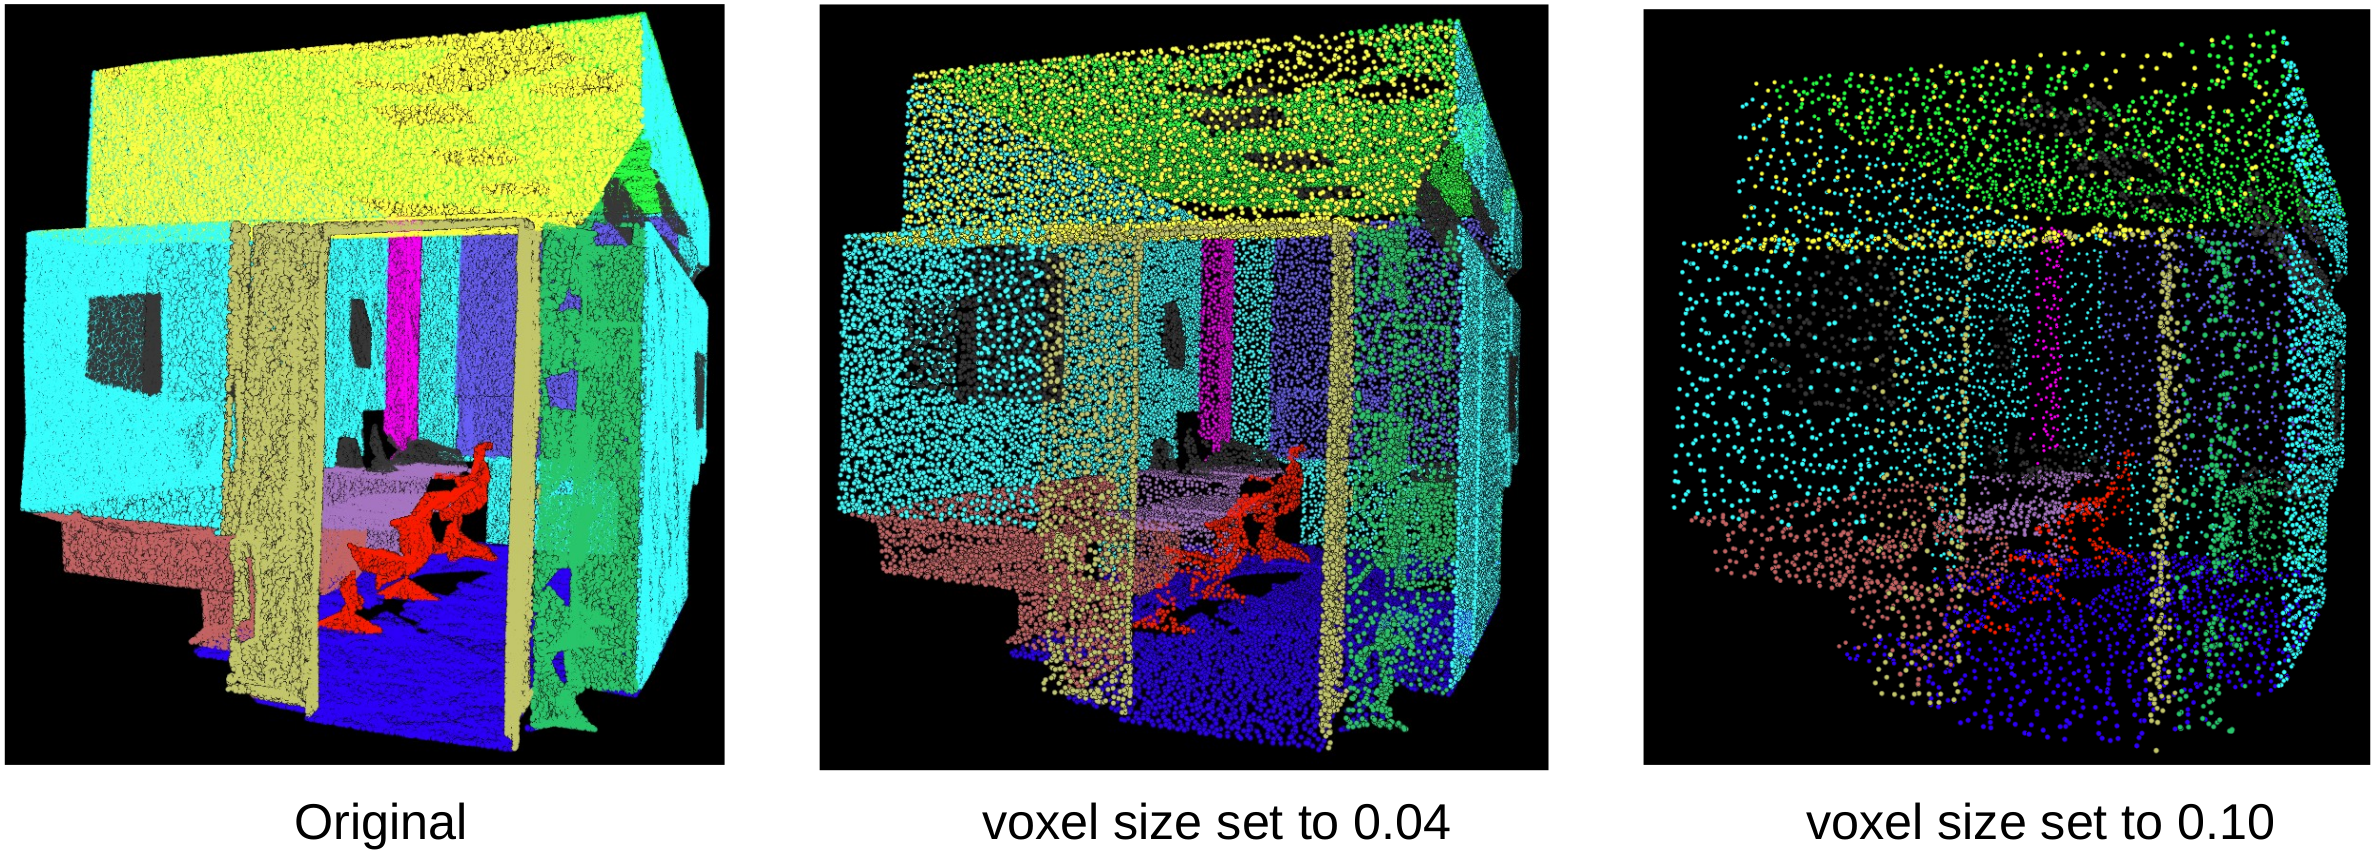
Figure 1: Illustration of the voxel downsampling with various voxel sizes
As can be seen in the figure 1, the point cloud becomes sparser as the voxel size increases but the points in the point cloud are normal distributed.
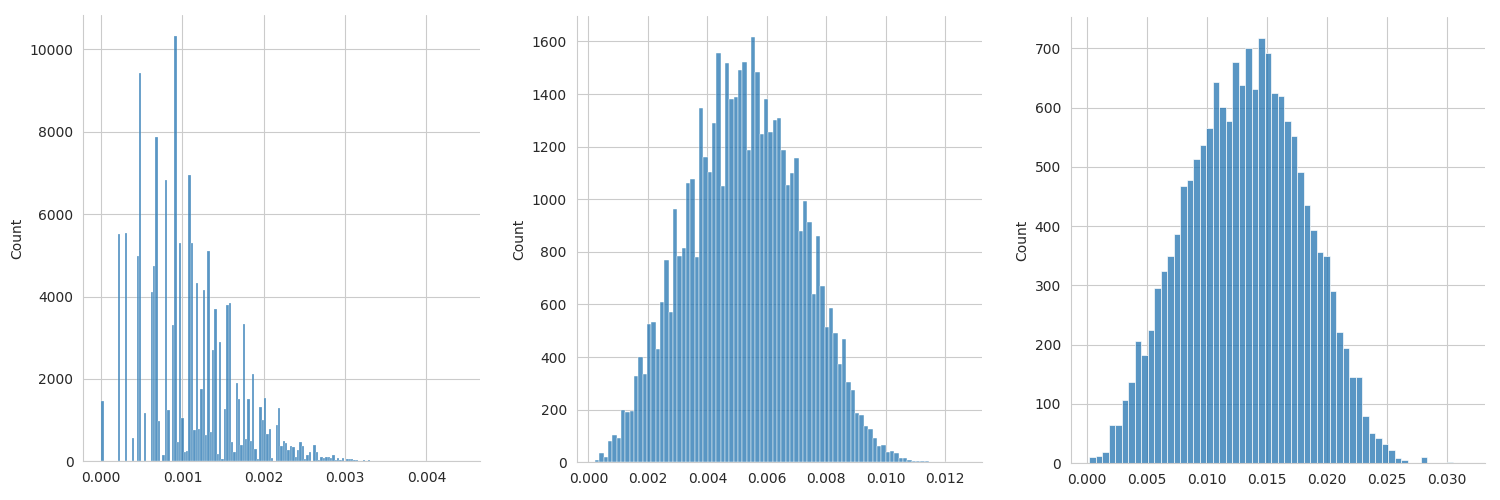
Figure 2: The approximate density distribution of the three point clouds from figure 1. After applying voxel downsampling the points in the point clouds become normal distributed
2. Neighborhood Sampling
Another neat method adopted by PointNeXt is neighborhood sampling. Neighborhood sampling queries a random point from the input point cloud and then samples the X nearest neighbors to the query point, where X depends on how many points can be fitted into your hardware and which batch size you train/evaluate with, but one also has to consider the point cloud density, shape and size. PointNeXt achieves SOTA on S3DIS with X set to 24.000. Neighborhood sampling is shown in figure 3.
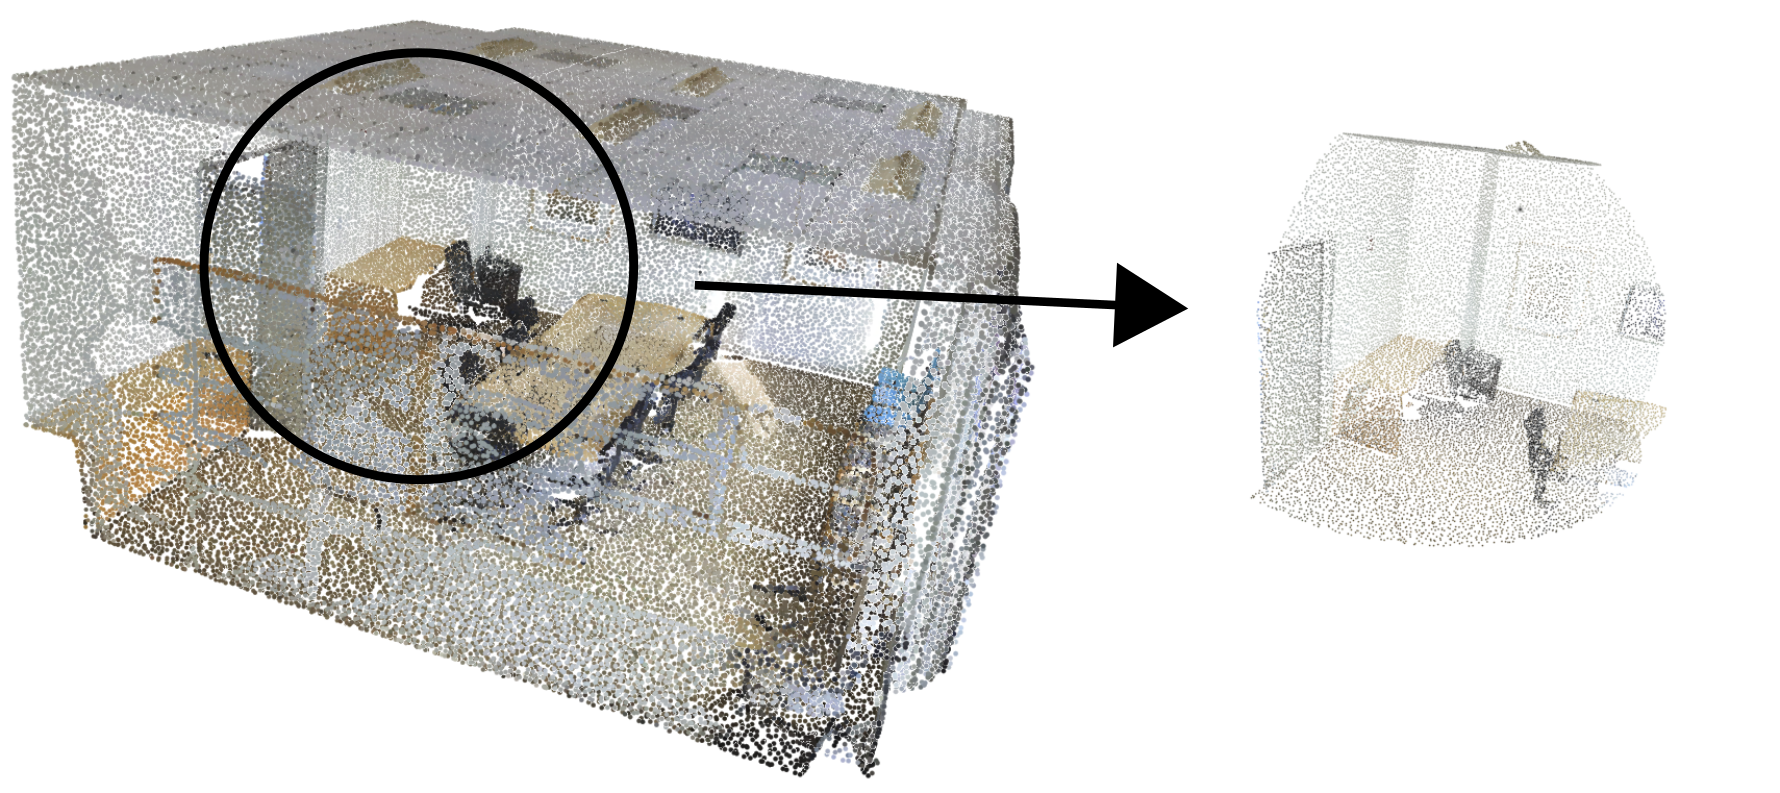
Figure 3: Illustrates the neighborhood sampling method. A random point is queried from the input point cloud and the X nearest points are then sampled for further processing. In this case X is set to 24.000
But what do we gain from just looking at a small neighborhood in the points clouds at each epoch? This is not clear, but two reasons could be:
- The model achieves a better trade-off between learned local- and global features. In a neighborhood sampled point cloud smaller objects are more visible than in an entire point cloud.
- The neighborhood sampled point clouds often have more spherical shapes, which might be beneficial when the point cloud becomes normalized and centered.
Note that at each epoch a new point is queried so after many epochs of training the model will very likely have seen most of every point cloud.
3. Data augmentation
The last method we are going to cover is data augmentation. Data augmentation is not a new method in any way, but the modern data augmentation methods adopted by PointNeXt play a large part of the performance gain over PointNet++ on the S3DIS and ScanObjectNN datasets, as seen in figure 4. The performance is measured by the mean intersection over union metric, which I've written about here: mIoU for 3D Semantic Segmentation
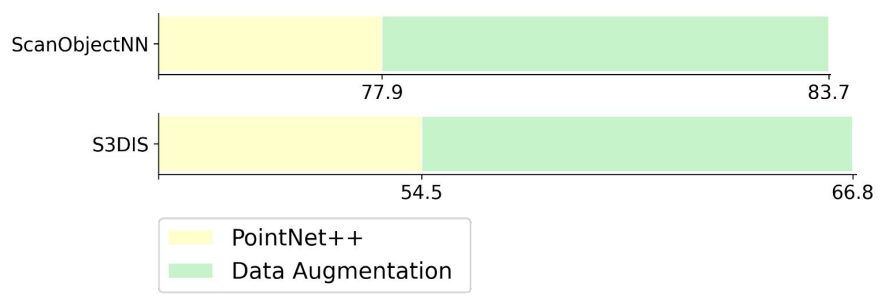
Figure 4: The mIoU performance of PointNet++ with and without modern data augmentation methods of PointNeXt
The data augmentation methods can be split into two main categories:
- Data augmentation methods which augments the colors of the point clouds.
- Data augmentation methods which augments the point coordinates of the point clouds.
The data augmentation methods are visualized in figure 5. Method a scales the coordinate of the input point cloud between 90%-110%. Thereby, shrinking or enlarging objects. Method b rotates the coordinates around the z-axis randomly between 0-360 degrees, thereby increasing the variation in how objects are turning. Method c aligns the input point cloud on the XY-plane, which means X- and Y coordinates are centered around (0,0). Method d randomly drops the colors of the input point cloud. This works as a regularization method, because the network learns that it can't always rely on the color features when segmenting points. Method e Normalizes the RGB-colors, such that color values range from -3 to 3 with 0 as mean instead of ranging from 0 to 255. Finally, method f is point jittering. This method radomly translates the coordinates of each point by a very small margin, thereby making sure objects never look exactly the same from epoch to epoch.
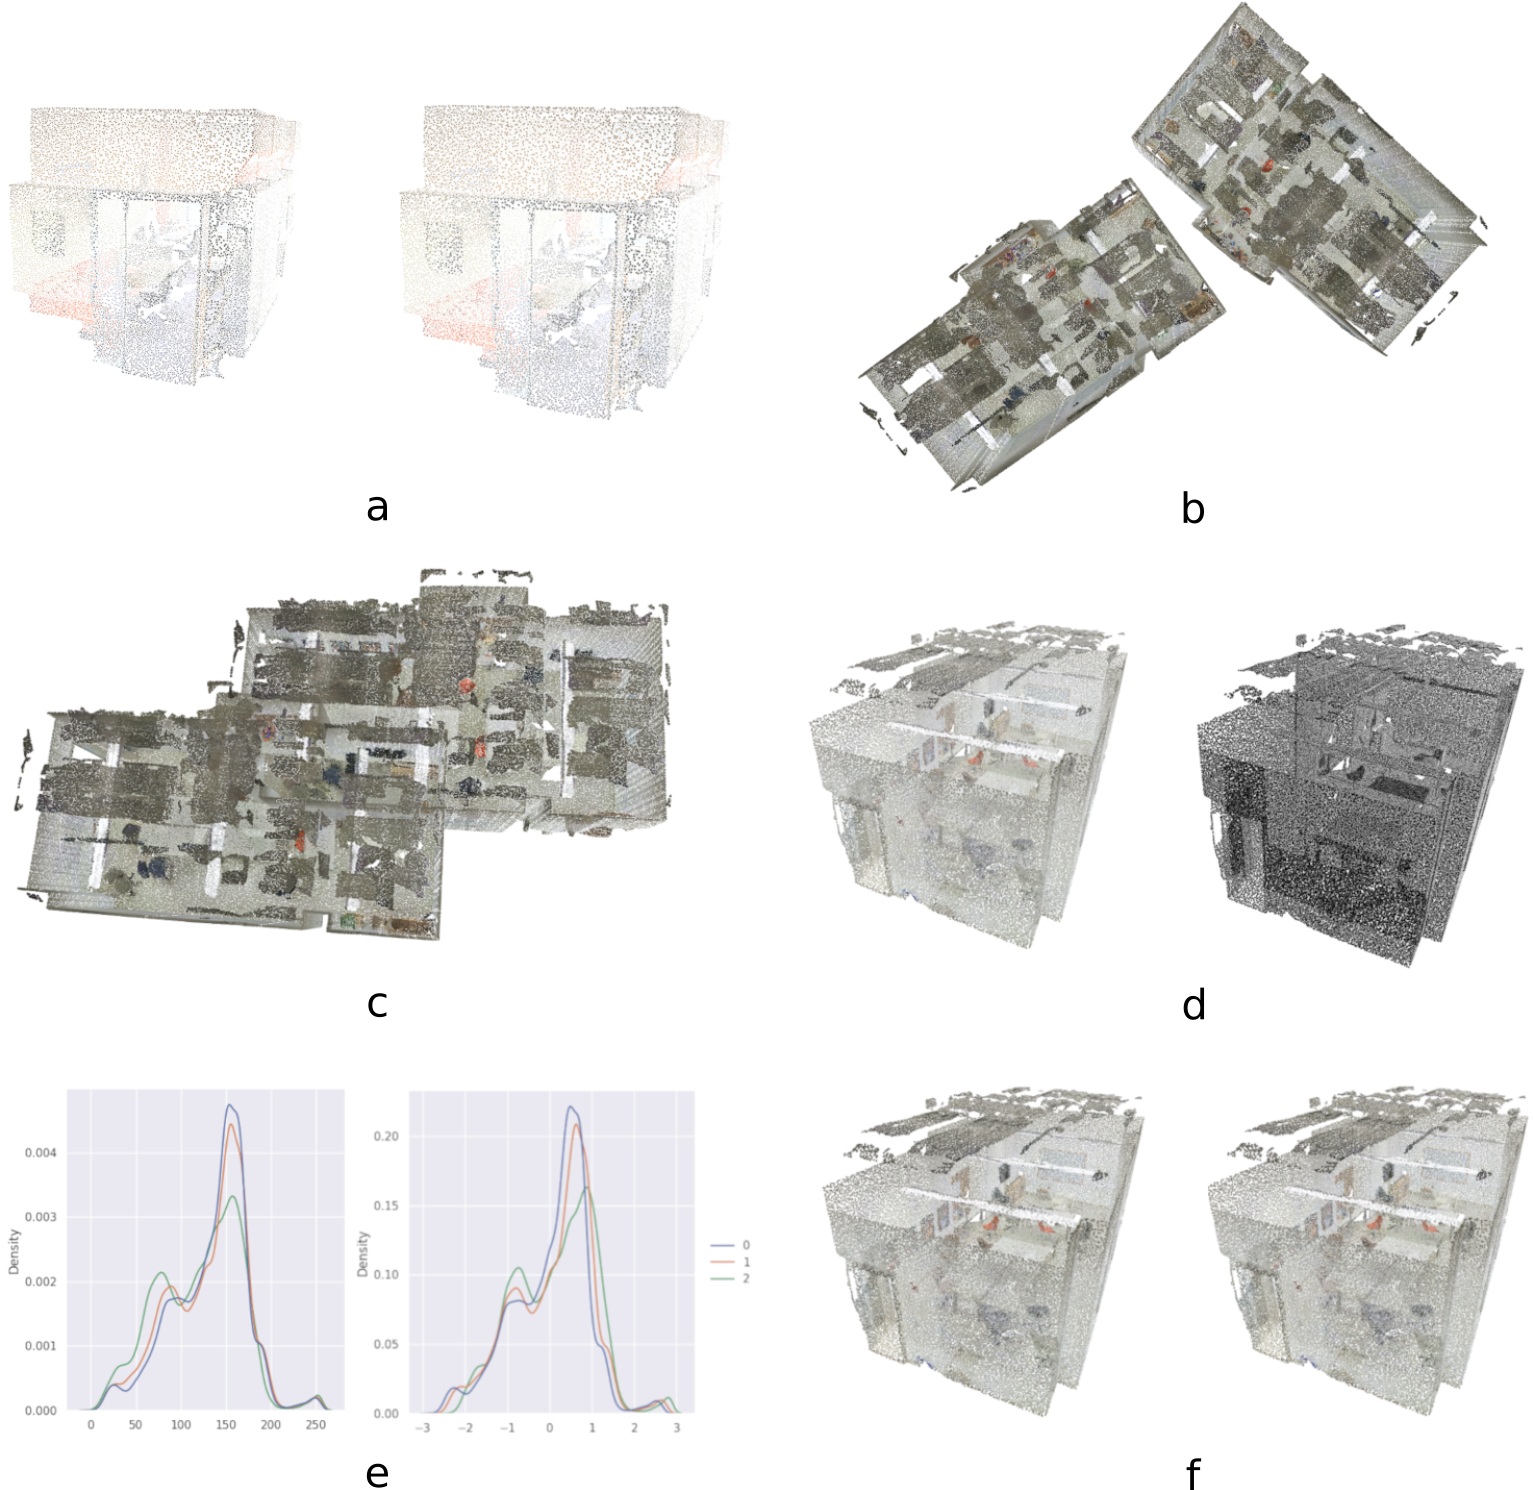
Figure 5: Overview of the data augmentation methods used by PointNeXt. (a) Point cloud scaling, (b) point cloud rotation around z-axis, (c) align points on the XY-plane, (d) drop colors randomly, (e) normalize colors, (f) point cloud jittering.
Summary:
We have now covered three fundamental methods used by PointNeXt, which helped it achieve SOTA performance on the S3DIS benchmark dataset. Besides from these methods, model size and the use of modern model layers are other important factors. For the full story, check out the original PointNeXt paper or the corresponding Github repository.
Thank you for reading! Please upvote and/or leave a comment below if you found this post interesting
Get back to my other posts here
